Sherpa Overview
Sherpa is a general purpose modeling and fitting application written in Python.
- Uses Python’s interactive capabilities and its Object Oriented Programming (OOP) approach.
- Provides a flexible environment for resolving spectral and image properties, analyzing time series, and modeling generic types of data.
- Implements the forward fitting technique for parametrized data modeling.
- Includes functions to calculate goodness-of-fit and parameter confidence limits.
- Data structures are contained in Python modules so users can easily add their own data structures, models, statistics or optimization methods to Sherpa.
- Complex model expressions are supported using a general purpose and compact definition syntax.
- Has a high-level UI that deals with a lot of the data management and general book-keeping you come across, but the low-level API can also be used (e.g. as part of a separate application).
In this tutorial we will show you how Sherpa can be used to model and fit 1D data (without and with errors) and 2D images. Higher dimensionality data is supported (to some extent) but there is no documentation. The 1D examples are for “unbinned” data, but you can also handle the case where the model has to be summed (integrated) across each bin (for the 2D case we treat image data as point/unbinned for convenience and speed).
Documentation
- Sherpa home page: Sherpa for CIAO users
- Sherpa python page: Sherpa for Python users
The Sherpa documentation collection includes a gallery of examples, fitting threads, and AHELP pages that describe each Sherpa function:
- Sherpa gallery: Examples by plot
- Sherpa fitting threads: Example scripts
- Sherpa AHELP pages: Function information
Load data into Sherpa
If you still have the 3C120 data from the NumPy introduction then go to the py4ast/core directory, otherwise
$ ipython --matplotlib

from astropy.extern.six.moves.urllib import request
import tarfile
url = 'http://python4astronomers.github.com/core/core_examples.tar'
tarfile.open(fileobj=request.urlopen(url), mode='r|').extractall()
cd py4ast/core
Now we load the Sherpa UI module and other requirements:
import sherpa.astro.ui as ui
import numpy as np
from astropy.io import fits
# import pycrates
# import pychips
and then the data, using the load_arrays command
img = fits.open('3c120_stis.fits.gz')[1].data
# cr = pycrates.read_file('3c120_stis.fits.gz')
# img = pycrates.get_piximgvals(cr)
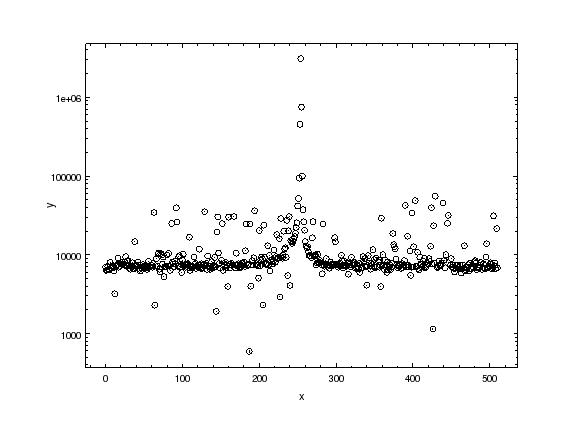
profile = img.sum(axis=1)
xaxis = np.arange(profile.size)
ui.load_arrays(1, xaxis, profile)
ui.plot_data()
# pychips.log_scale(pychips.Y_AXIS)
Note
I will be using the CIAO version of Sherpa for the demonstation, but
feel free to use the standalone version. Here we load the data into
dataset number 1 (which is the default); data set ids can be
integers or strings (for example “src” and “bgnd”). Some routines
work on a single dataset and some on all; for some commands
the id value can be left out to use the default (plot_data
is and load_arrays isn’t).
Hint
Try out d1 = ui.get_data() and dir(d1).
Set up the model
The aim is to determine the approximate spatial extent of the profile, so we start with a gaussian:
ui.set_source(ui.gauss1d.g1)
print(g1)
gauss1d.g1
   Param        Type          Value          Min          Max      Units
   -----        ----          -----          ---          ---      -----
   g1.fwhm      thawed           10  1.17549e-38  3.40282e+38
   g1.pos       thawed            0 -3.40282e+38  3.40282e+38
   g1.ampl      thawed            1 -3.40282e+38  3.40282e+38
Note
The Sherpa UI uses fancy Python magic to create a variable with
the name of the model component - in this case g1 - which is
then used to read and modify the model parameters. Parameters
have a value, range, and can be thawed (can be adjusted during
a fit) or frozen (will not be fixed).
Hint
Try out dir(g1). As shown below, the source expression
can be retrieved with ui.get_source.
It would be nice if the optimizer were guaranteed to find the
best fit no matter where you start (and the quality of the data),
but it often helps to try and give the system a helping hand.
One way to do this is via the guess command, which
uses simple heuristics to initialize some of the
parameter values and ranges (the algorithm used depends on
the model).
ui.freeze(g1.fwhm)
ui.guess(g1)
ui.thaw(g1.fwhm)
print(g1)
gauss1d.g1
   Param        Type          Value          Min          Max      Units
   -----        ----          -----          ---          ---      -----
   g1.fwhm      thawed           10  1.17549e-38  3.40282e+38
   g1.pos       thawed          254            0          511
   g1.ampl      thawed  3.11272e+06      3112.72  3.11272e+09
Note
The reason for freezing the fwhm parameter before the guess
is to avoid a strange error message
(ParameterErr: parameter g1.fwhm
has a hard minimum of 1.17549e-38) that is specific to the
gauss1d model.
Selecting a statistic and optimizer
For this dataset we have no errors so use the least-squared statistic, and the default optimizer (the Levenberg-Marquardt method). Other choices for the statistic are gaussian - with a range of error estimates - or Cash, and optimizers are Simplex and a Monte-Carlo based method. Some situations require a particular choice, but it can be useful to change values to check that you are at the best-fit location (or, to avoid the wrath of any Statistician, the local minimum).
ui.set_stat('leastsq')
print(ui.get_method())
name    = levmar
ftol    = 1.19209289551e-07
xtol    = 1.19209289551e-07
gtol    = 1.19209289551e-07
maxfev  = None
epsfcn  = 1.19209289551e-07
factor  = 100.0
verbose = 0
Note
The parameters for the optimizers (e.g. ftol for levmar)
should be left alone unless you get really stuck and know
what you are doing.
Now the fit
For this example, the fit is quick (it does not take many iterations):
ui.fit()
Dataset               = 1
Method                = levmar
Statistic             = leastsq
Initial fit statistic = 5.46696e+13
Final fit statistic   = 9.55741e+10 at function evaluation 34
Data points           = 512
Degrees of freedom    = 509
Change in statistic   = 5.4574e+13
   g1.fwhm        1.28959
   g1.pos         254.075
   g1.ampl        3.14129e+06
and we repeat just to make sure:
ui.fit()
Dataset               = 1
Method                = levmar
Statistic             = leastsq
Initial fit statistic = 9.55741e+10
Final fit statistic   = 9.55741e+10 at function evaluation 5
Data points           = 512
Degrees of freedom    = 509
Change in statistic   = 0
   g1.fwhm        1.28959
   g1.pos         254.075
   g1.ampl        3.14129e+06
Note
The exact values you get depend on both the OS and build type (32 vs 64 bit).
Hint
The fit command will fit all loaded datasets when called
with no id; use fit(1) to fit a single dataset.
The screen output from the fit command can also be
retrieved as a structure (a Python object) using the
ui.get_fit_results() command.
View the fit
The fit can be viewed graphically (the warnings can be ignored):
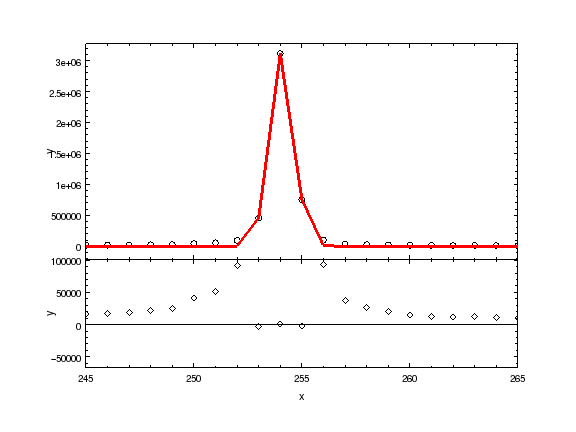
ui.plot_fit()
WARNING: unable to calculate errors using current statistic: leastsq
ui.plot_fit_resid()
WARNING: unable to calculate errors using current statistic: leastsq
WARNING: unable to calculate errors using current statistic: leastsq
# pychips.limits(pychips.X_AXIS, 245, 265)
Hint
The level of screen output created by Sherpa can be controlled using the Python logging module. Unless you have used a similar library in another language, it will appear needlessly complex (as it does a lot) and we unfortunately don’t have time to discuss it here.
Adding a component
We can re-use existing components in a source expression:
ui.set_source(g1 + ui.const1d.bgnd)
print(ui.get_source())
(gauss1d.g1 + const1d.bgnd)
   Param        Type          Value          Min          Max      Units
   -----        ----          -----          ---          ---      -----
   g1.fwhm      thawed      1.28959  1.17549e-38  3.40282e+38
   g1.pos       thawed      254.075            0          511
   g1.ampl      thawed  3.14129e+06      3112.72  3.11272e+09
   bgnd.c0      thawed            1            0  3.40282e+38
Rather than using guess, let’s see how well the optimizer does:
ui.fit()
Dataset = 1
Method = levmar
Statistic = leastsq
Initial fit statistic = 9.55644e+10
Final fit statistic = 4.96699e+10 at function evaluation 16
Data points = 512
Degrees of freedom = 508
Change in statistic = 4.58945e+10
g1.fwhm 1.28402
g1.pos 254.076
g1.ampl 3.1326e+06
bgnd.c0 9497.67
ui.fit()
Dataset = 1
Method = levmar
Statistic = leastsq
Initial fit statistic = 4.96699e+10
Final fit statistic = 4.96699e+10 at function evaluation 6
Data points = 512
Degrees of freedom = 508
Change in statistic = 0
g1.fwhm 1.28402
g1.pos 254.076
g1.ampl 3.1326e+06
bgnd.c0 9497.67
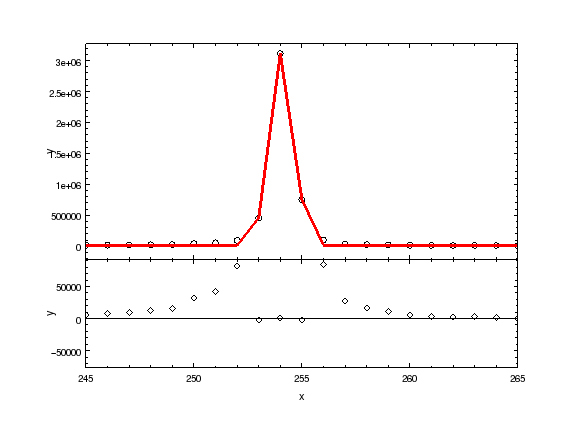
ui.plot_fit_resid()
# pychips.limits(pychips.X_AXIS, 245, 265)
Evaluating the model expression directly
Model components and source expressions can be evaluated directly,
although this approach only works for simple models; that is those
without convolution (either explicitly via ui.set_psf or implictly
as happens with the handling of the response information in X-ray
data).:
xi = np.arange(250, 260)
src = ui.get_source()
yi = src(xi)

zip(xi, yi)
[(250, 9497.6705120244224),
 (251, 9498.0568224326398),
 (252, 11732.300774634092),
 (253, 457003.64642740792),
 (254, 3112045.5828799075),
 (255, 754169.02805867838),
 (256, 15685.485177760009),
 (257, 9499.4505770869582),
 (258, 9497.6705274404576),
 (259, 9497.6705097123686)]
Note
The zip command is one of those utility functions that
comes in really handy.
Hint
There are a family of commands, such as ui.get_data_plot,
ui.get_model_plot, and ui.get_fit_plot which provide
access to the data used to create the corresponding plot command.
This is one way to handle those models which include a convolution
component.
I want to find those columns that are significantly higher than
the background, so let’s try bgnd.c0 + 5:
print(xi[yi > bgnd.c0 + 5])
[]
Well, that was unexpected! So what went wrong?:
bgnd.c0 + 5
<BinaryOpParameter '(bgnd.c0 + 5)'>
In order to support linked parameters
(demonstrated in the next section <spectrum.html>), and a
bunch of other sparkly goodness, the
value bgnd.c0 is actually a Python object. To get at its value
you have to use the val field:
bgnd.c0
<Parameter 'c0' of model 'bgnd'>
bgnd.c0.val
9497.6705097123631
bgnd.c0.val + 5
9502.6705097123631
print(xi[yi>bgnd.c0.val + 5])
[252 253 254 255 256]
Saving the session
The save command can be used to store the
current session as a single file.:
ui.save("3c120.sherpa")
This file can then be
loaded into a new session with the restore command.:
$ ipython --matplotlib

In [1]: import sherpa.astro.ui as ui

In [2]: ui.restore("simple1.sherpa")
 Solar Abundance Vector set to angr:  Anders E. & Grevesse N. Geochimica et Cosmochimica Acta 53, 197 (1989)
 Cross Section Table set to bcmc:  Balucinska-Church and McCammon, 1998

In [3]: ui.show_all()
Data Set: 1
Filter: 0.0000-511.0000 x
name      =
x         = Int64[512]
y         = Float32[512]
staterror = None
syserror  = None

Model: 1
(gauss1d.g1 + const1d.bgnd)
   Param        Type          Value          Min          Max      Units
   -----        ----          -----          ---          ---      -----
   g1.fwhm      thawed      1.28402  1.17549e-38  3.40282e+38
   g1.pos       thawed      254.076            0          511
   g1.ampl      thawed   3.1326e+06      3112.72  3.11272e+09
   bgnd.c0      thawed      9497.67            0  3.40282e+38

Optimization Method: LevMar
name    = levmar
ftol    = 1.19209289551e-07
xtol    = 1.19209289551e-07
gtol    = 1.19209289551e-07
maxfev  = None
epsfcn  = 1.19209289551e-07
factor  = 100.0
verbose = 0

Statistic: LeastSq
Least Squared

Fit:Dataset               = 1
Method                = levmar
Statistic             = leastsq
Initial fit statistic = 4.96699e+10
Final fit statistic   = 4.96699e+10 at function evaluation 6
Data points           = 512
Degrees of freedom    = 508
Change in statistic   = 0
   g1.fwhm        1.28402
   g1.pos         254.076
   g1.ampl        3.1326e+06
   bgnd.c0        9497.67
Note
The save command takes advantage of Python’s pickling
capabilities. The result is a binary file that can be shared between
machines, even on a different OS or - I believe - 32 and 64 bit
variants. This makes sharing fits with colleagues very easy
- e.g. via DropBox - but has some downsides: it is not guaranteed
that the files can be used with different versions of Sherpa;
you can’t manually inspect the file to see what was done;
and those people implementing advanced features
(e.g. user models or statistics) may not
support this functionality. The ui.save_all command
writes out a Python script, but it is aimed mainly at users who
load in data from files rather than with the load_arrays
command.