The low-level Sherpa API
Here we repeat our fit to the 3C273 spectrum, but with the low-level API (and without going quite as far in the analysis).
Explore the Sherpa Object Model
In a new working directory, download a MAST spectrum of 3C 273
and start IPython along with the standard imports:
$ ipython --matplotlib

import numpy as np
import matplotlib.pyplot as plt
If you have trouble accessing the spectrum you can download it straight away using Python:
from astropy.extern.six.moves.urllib import request
url = 'http://python4astronomers.github.com/_downloads/3c273.fits'
open('3c273.fits', 'wb').write(request.urlopen(url).read())
%ls
Import a few Sherpa classes needed to characterize a fit:
from sherpa.data import Data1D
from sherpa.models import PowLaw1D
from sherpa.stats import Chi2DataVar
from sherpa.optmethods import LevMar
from sherpa.fit import Fit
Import the Python FITS reader astropy.io.fits and open the spectrum as a table:
from astropy.io import fits
dat = fits.open('3c273.fits')[1].data
Access the WAVELENGTH and FLUX columns from the pyFITS RecArray. Populate
variables represented as wave, flux, and err. Normalize the flux and assume
uncertainties of 2% of the flux:
wave = dat.field('WAVELENGTH')
flux = dat.field('FLUX') * 1e14
err  = dat.field('FLUX') * 0.02e14
Create a Sherpa Data1D data set from the NumPy arrays wave, flux, and
err. The data arrays are accessible from the data object as the attributes
x, y, and staterror:
data = Data1D('3C 273', wave, flux, err)
print(data)
Array access:
print('x {0}'.format(data.x))
print('y {0}'.format(data.y))
print('err {0}'.format(data.staterror))
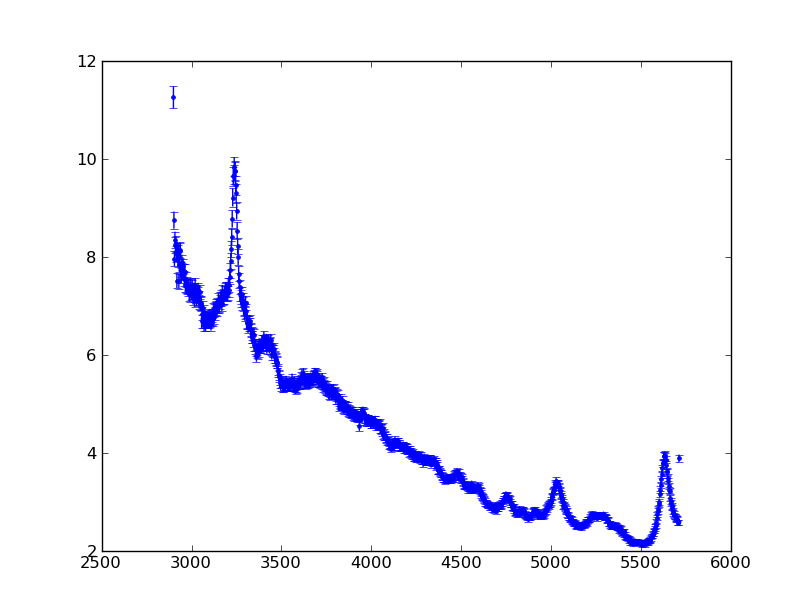
Define a convenience function plot_data that calls the matplotlib functions
plot and errorbar according to certain criteria. Plot the x and
y arrays using the format specified in the optional argument, fmt.
Clear the plot if the clear argument is True. Add the plot errorbars if
the err array is present. Plot the spectrum by accessing the NumPy arrays
in the Sherpa data set using our new function and its default arguments:
def plot_data(x, y, err=None, fmt='.', clear=True):
    if clear:
        plt.clf()
    plt.plot(x, y, fmt)
    if err is not None:
        plt.errorbar(x, y, err, fmt=None, ecolor='b')

plot_data(data.x, data.y, data.staterror)
Create a Sherpa power-law model pl. All Sherpa models maintain a tuple of
parameters in pars. Access each of the model’s parameter objects and print
the name and val attributes:
pl = PowLaw1D('pl')
pl.pars
for par in pl.pars:
    print('{0} {1}'.format(par.name, par.val))

print(pl)
Set the power-law reference to be 4000 Angstroms and print out the PowLaw1D
object and its parameter information. Each model parameter is accessible as an
attribute its model. For example, the power-law amplitude is referenced with
pl.ampl:
pl.ref = 4000.
print(pl)
Model parameters are themselves class objects:
print(pl.ampl)
Exercise (for the interested reader): Special methods and properties
Wait. Didn’t we just set pl.ref to be an float? How can pl.ref be an
float and a Parameter object?
Click to Show/Hide Solution
The answer is that pl.ref is in fact an object, but its model class supports a
special setter method __setattr__() that updates the pl.ref.val attribute
underneath. The property function defines custom getter and setter
functions for a particular class attribute:
class Parameter(object):
    def __init__(self):
        # private attribute intended to be reference as 'val'.
        self._value = 1.0

    def _get_val(self): return self._value
    def _set_val(self, value): self._value = value
    # setup a 'val' attribute
    val = property(_get_val, _set_val)

class Model(object):
    def __setattr__(self, name, val):
        if isinstance(getattr(self, name, None), Parameter):
            getattr(self, name).val = val
        else:
            object.__setattr__(self, name, val)
    def __init__(self):
        self.ref = Parameter()

m = Model()
m.ref
m.ref = 4
m.ref
m.ref.val
Create a Fit object made up of a Sherpa data set, model, fit statistic, and
optimization method. Fit the spectrum to a power-law with least squares
(Levenberg-Marquardt) using the chi-squared statistic with data variance:
f = Fit(data, pl, Chi2DataVar(), LevMar())
result = f.fit()
print(result)
# or alternatively
print(result.format())
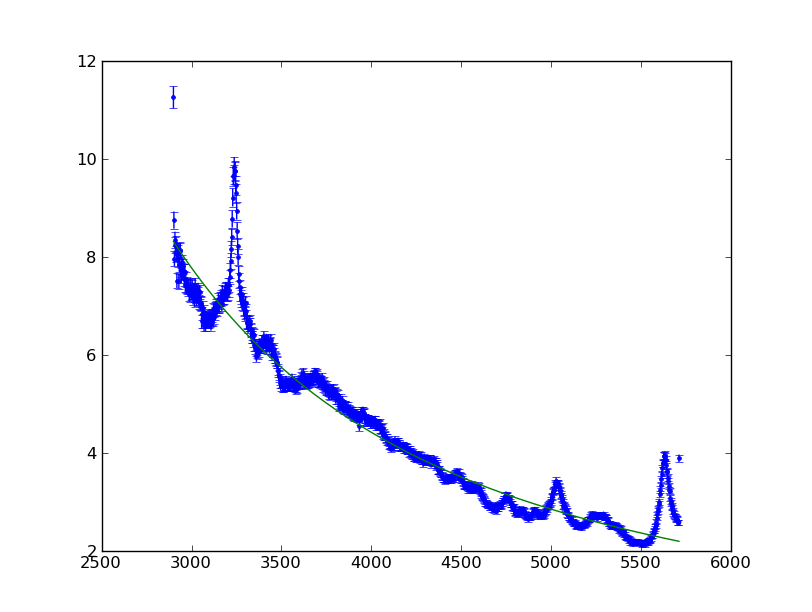
Over-plot the fitted model atop the data points using our convenience function
plot_data. This time calculate the model using the best-fit parameter
values over the data.x and plot using a custom format and indicate
clear=False:
plot_data(data.x, pl(data.x), fmt="-", clear=False)