Reading and Writing tabular ASCII data
Astronomers love storing tabular data in human-readable ASCII tables. Unfortunately there is very little agreement on a standard way to do this, unlike e.g. FITS.
Pure Python
Reading
We have already talked about Python Built-in Types and Operations, but
there are more types that we did not speak about. One of these is the
file() object which can be used to read or write files.
Let’s start off by downloading this data file, then launching IPython the directory where you have the file:
$ ipython --matplotlib
Do the usual imports of numpy and matplotlib:
import numpy as np
import matplotlib.pyplot as plt
If you have trouble downloading the file, then from within IPython enter:
from astropy.extern.six.moves.urllib import request
url = 'http://python4astronomers.github.com/_downloads/data.txt'
open('data.txt', 'wb').write(request.urlopen(url).read())
ls
Now let’s try and get the contents of the file into IPython. We start off by creating a file object:
f = open('data.txt', 'r')
The 'r' means that the file should be opened in read mode (i.e. you will get an error if the file does not exist). Now, simply type:
f.read()
and you will see something like this:
>>> f.read()
'RAJ        DEJ                          Jmag   e_Jmag\n2000 (deg) 2000
(deg) 2MASS             (mag)  (mag) \n---------- ----------
----------------- ------ ------\n010.684737 +41.269035 00424433+4116085
9.453  0.052\n010.683469 +41.268585 00424403+4116069   9.321
0.022\n010.685657 +41.269550 00424455+4116103  10.773  0.069\n010.686026
+41.269226 00424464+4116092   9.299  0.063\n010.683465 +41.269676
00424403+4116108  11.507  0.056\n010.686015 +41.269630
00424464+4116106   9.399  0.045\n010.685270 +41.267124
00424446+4116016  12.070  0.035\n'
The data file has been read in as a single string. Let’s try that again:
>>> f.read()
''
What’s happened? We read the file, and the file ‘pointer’ is now sitting at the end of the file, and there is nothing left to read. Let’s now try and do something more useful, and capture the contents of the file in a string:
f = open('data.txt', 'r')  # We need to re-open the file
data = f.read()
f.close()
Now data contains a string:
>>> type(data)
<type 'str'>
Closing files
Usually, you should close file when you are done with it to free up resources (memory). If you only have a couple of files in an interactive session, that is not dramatic. On the other hand, if you write scripts which deal with dozens of files, then you should start worrying about these things. Often you will see things like this:
with open('data.txt', 'r') as f:
    # do things with your file
    data = f.read()

type(data)
Notice the indent under the with. At the end of that block the
file is automatically closed, even if things went wrong and an error
occured inside the with block.
But what we’d really like to do is read the file line by line. There are several ways to do this, the simplest of which is to use a for loop in the following way:
f = open('data.txt', 'r')
for line in f:
    print(repr(line))
Notice the indent before print, which is necessary to indicate that we are inside the loop (there is no end for in Python). Note that we are using repr() to show any invisible characters (this will be useful in a minute). The output should now look something like this:
>>> for line in f:
        print(repr(line))

'RAJ        DEJ                          Jmag   e_Jmag\n'
'2000 (deg) 2000 (deg) 2MASS             (mag)  (mag) \n'
'---------- ---------- ----------------- ------ ------\n'
'010.684737 +41.269035 00424433+4116085   9.453  0.052\n'
'010.683469 +41.268585 00424403+4116069   9.321  0.022\n'
'010.685657 +41.269550 00424455+4116103  10.773  0.069\n'
'010.686026 +41.269226 00424464+4116092   9.299  0.063\n'
'010.683465 +41.269676 00424403+4116108  11.507  0.056\n'
'010.686015 +41.269630 00424464+4116106   9.399  0.045\n'
'010.685270 +41.267124 00424446+4116016  12.070  0.035\n'
Each line is being returned as a string. Notice the \n at the end of each line - this is a line return character, which indicates the end of a line.
Note
You may also come across the following way to read files line by line:
for line in f.readlines():
    ...
f.readlines() actually reads in the whole file and splits it
into a list of lines, so for large files this can be memory
intensive. Using:
for line in f:
    ...
instead is more memory efficient because it only reads one line at a time.
Now we’re reading in a file line by line, what would be really nice would be to get some values out of it. Let’s examine the last line in detail. If we just type line we should see the last line that was printed in the loop:
>>> line
'010.685270 +41.267124 00424446+4116016  12.070  0.035\n'
We can first get rid of the \n character with:
>>> line = line.strip()
>>> line
'010.685270 +41.267124 00424446+4116016  12.070  0.035'
Next, we can use what we learned about strings and lists to do:
>>> columns = line.split()
>>> columns
['010.685270', '+41.267124', '00424446+4116016', '12.070', '0.035']
Finally, let’s say we care about the source name, and the J band magnitude. We can extract these with:
>>> name = columns[2]
>>> j = columns[3]

>>> name
'00424446+4116016'

>>> j
'12.070'
Note that j is a string, but if we want a floating point number, we can instead do:
>>> j = float(columns[3])
One last piece of information we need about files is how we can read a single line. This is done using:
line = f.readline()
We can put all this together to write a little script to read the data from the file and display the columns we care about to the screen! Here is is:
# Open file
f = open('data.txt', 'r')

# Read and ignore header lines
header1 = f.readline()
header2 = f.readline()
header3 = f.readline()

# Loop over lines and extract variables of interest
for line in f:
    line = line.strip()
    columns = line.split()
    name = columns[2]
    j = float(columns[3])
    print(name, j)

f.close()
The output should look like this:
00424433+4116085 9.453
00424403+4116069 9.321
00424455+4116103 10.773
00424464+4116092 9.299
00424403+4116108 11.507
00424464+4116106 9.399
00424446+4116016 12.07
Exercise
Try and see if you can understand what the following script is doing:
f = open('data.txt', 'r')
header1 = f.readline()
header2 = f.readline()
header3 = f.readline()
data = []
for line in f:
    line = line.strip()
    columns = line.split()
    source = {}
    source['name'] = columns[2]
    source['j'] = float(columns[3])
    data.append(source)
After this script is run, how would you access the name and J-band magnitude of the third source?
Click to Show/Hide Solution
The following line creates an empty list to contain all the data:
data = []
For each line, we are then creating an empty dictionary and populating it with variables we care about:
source = {}
source['name'] = columns[2]
source['j'] = float(columns[3])
Finally, we append this source to the data list:
data.append(source)
Therefore, data is a list of dictionaries:
>>> data
[{'j': 9.453, 'name': '00424433+4116085'},
 {'j': 9.321, 'name': '00424403+4116069'},
 {'j': 10.773, 'name': '00424455+4116103'},
 {'j': 9.299, 'name': '00424464+4116092'},
 {'j': 11.507, 'name': '00424403+4116108'},
 {'j': 9.399, 'name': '00424464+4116106'},
 {'j': 12.07, 'name': '00424446+4116016'}]
You can access the dictionary for the third source with:
>>> data[2]
{'j': 10.773, 'name': '00424455+4116103'}
To get the name of this source, you can therefore do:
>>> data[2]['name']
'00424455+4116103'
Writing
To open a file for writing, use:
f = open('data_new.txt', 'wb')
Then simply use f.write() to write any content to the file, for example:
f.write("Hello, World!\n")
If you want to write multiple lines, you can either give a list of strings to the writelines() method:
f.writelines(['spam\n', 'egg\n', 'spam\n'])
or you can write them as a single string:
f.write('spam\negg\nspam')
To close a file, simply use:
f.close()
(this also applies to reading files)
Exercise
Let’s try combining reading and writing. Using at most seven lines, write a script which will read in data.txt, replace any spaces with periods (.), and write the result out to a file called data_new.txt.
Can you do it in a single line? (you can ignore closing the file)
Click to Show/Hide Solution
Here is a possible solution:
f1 = open('data.txt', 'r')
content = f1.read()
f1.close()

content = content.replace(' ','.')

f2 = open('data_new.txt', 'w')
f2.write(content)
f2.close()
And a possible one-liner!:
open('data_new.txt', 'w').write(open('data.txt', 'r').read().replace(' ', '.'))
astropy.io.ascii
In the previous section you learned about reading and writing tabular data files using direct Python I/O and simple parsing and type-conversion rules. This is important base knowledge, but in real-world use when dealing with ASCII data files there are many complications and we recommend using the astropy.io.ascii module. It natively understands (and can automatically detect) most of the formats which astronomers typically encounter. As of Astropy 1.0 it includes C-based read and write methods which are much faster than any pure-Python implementations.
The astropy.io.ascii module supports these formats:
- AASTex: AASTeX
deluxetableused for AAS journals - Basic: basic table with customizable delimiters and header configurations
- Cds: CDS format table (also Vizier and ApJ machine readable tables)
- CommentedHeader: column names given in a line that begins with the comment character
- Daophot: table from the IRAF DAOphot package
- ECSV: Enhanced Character-Separated-Values
- FixedWidth: table with fixed-width columns (see also fixed_width_gallery)
- Ipac: IPAC format table
- HTML: HTML format table contained in a <table> tag
- Latex: LaTeX table with datavalue in the
tabularenvironment - NoHeader: basic table with no header where columns are auto-named
- Rdb: tab-separated values with an extra line after the column definition line
- SExtractor: SExtractor format table
- Tab: tab-separated values
Reading tables
from astropy.io import ascii
table = """
col1 col2 col3
1    2    "hi there"
3    4.2  world"""
data = ascii.read(table)
The first and most important argument to the ascii.read() function is the table input. There is some flexibility here and you can supply any of the following:
- Name of a file (string)
- Single string containing all table lines separated by newlines
- File-like object with a callable read() method
- List of strings where each list element is a table line
Guessing
Even though it seems obvious to a human, parsing this table to get the right column names, data values and data types is not trivial. astropy.io.ascii needed to figure out (or guess):
- Overall table format (DAOphot, CDS, RDB, Basic, etc)
- Column delimiter, e.g. space, comma, tab, vertical bar, etc.
- Column names (which row, maybe preceded by #)
- Quote character (single or double quote)
By default astropy.io.ascii will try each format it knows and use the first one that gives a “reasonable” answer. The details are in the Guess table format section. Sometimes it will fail, e.g.:
table = """
col1 & col2
  1  & hi there
  3  & world
"""
ascii.read(table)
This gives an ominous looking stack trace, but actually all that happened is that astropy.io.ascii guessed every format it knows and nothing worked. The standard set of column delimiters is space, comma, tab, and the vertical bar. In this case you simply need to give it some help:
ascii.read(table, delimiter="&")
The full list of parameters for reading includes common options like
format, delimiter, quote_char, and comment.
No guessing
For some tricky tables you will want to disable guessing and explicitly provide the relevant table format information to the ascii.read() function. A big advantage in this strategy is that astropy.io.ascii can then provide more detailed information if it still fails to parse the table, e.g.:
ascii.read(table, guess=False, format='basic')
This produces a message (after the stacktrace) that should be a pretty good clue that astropy.io.ascii is using the wrong column delimiter:
InconsistentTableError: Number of header columns (3) inconsistent with data columns (4) at data line 0
Header values: ['col1', '&', 'col2']
Data values: ['1', '&', 'hi', 'there']
Writing
You can write ASCII tables using the ascii.write() function. There is a lot of flexibility in the format of the input data to be written:
- NumPy structured array or record array
- astropy Table object
- Sequence of sequences
- Dict of sequences
As a first simple example, read a comma-delimited table and then write it out as space-delimited:
table = """
col1,col2,col3
1,hello world,2.5
3,again,5.0"""
dat = ascii.read(table)

import sys
ascii.write(dat, sys.stdout)  # print to terminal instead of to file
We can use a different column delimiter:
ascii.write(dat, sys.stdout, delimiter='|')
or a different table writer class:
ascii.write(dat, sys.stdout, format='latex')
As a final example, imagine you’ve gathered basic information about 5 galaxies which you want to write as an ASCII table. You could just use pure Python file I/O as shown earlier, but then you may need to be careful about quoting and formatting (and why rewrite the same code every time when it is already done!). Instead just use astropy.io.ascii:
types = ['barred spiral', 'spiral', 'peculiar (ring)', 'elliptical', 'elliptical']
redshifts = np.array([0.024221, 0.132, 0.22, 0.34, 0.45])
lums = np.array([1e40, 1.2e40, 2e40, 3e40, 4e40])
table = {'type': types, 'redshift': redshifts, 'lum': lums}

ascii.write(table, 'galaxies.dat', formats={'redshift': '%.5f', 'lum': '%.2e'})
cat galaxies.dat
Exercise: scraping table data from the web
Note: this exercise only works on Python 2 due to BeautifulSoup doing something differently in Python 3. Five cheers to the person who can fix this!
To do this exercise you must first install the BeautifulSoup package which will parse HTML pages into nice data structures. QUIT your IPython session and from the command line do:
pip install --upgrade beautifulsoup4
Now start IPython again. The exercise is to grab the table data from the XJET catalog page into a Python data structure. First we’ll show you the really easy answer using the HTML reading capability of astropy.io.ascii:
dat = ascii.read('http://hea-www.harvard.edu/XJET/',
                 format='html',
                 htmldict={'table_id':2},  # Get data from the second table
                 fill_values=('', '-1'),   # Fill blank entries with -1
                 header_start=0,           # Row 0 is header with column names
                 data_start=1)             # Row 1 is start of table data
But in order to understand the guts of how this works, start by defining following function which converts an HTML table to a list of lines with tab-separated values (this will be more clear in the next part):
from bs4 import BeautifulSoup
def html2tsv(html, index=0):
    """Parse the index'th HTML table in ``html``.  Return table as a list of
    tab-separated ASCII table lines"""
    soup = BeautifulSoup(html)
    tables = soup.findAll('table')
    table = tables[index]
    out = []
    for row in table.findAll('tr'):
        colvals = [col.text for col in row.findAll('td')]
        out.append('\t'.join(colvals))
    return out
You’ll want to start with:
from astropy.extern.six.moves.urllib import request
from astropy.io import ascii
html = request.urlopen('http://hea-www.harvard.edu/XJET/').read()  # Get web page as string
table1 = html2tsv(html, 0)   # Parse the first table in the web page
table2 = html2tsv(html, 1)   # Parse the second table
table3 = html2tsv(html, 2)   # Parse the third table
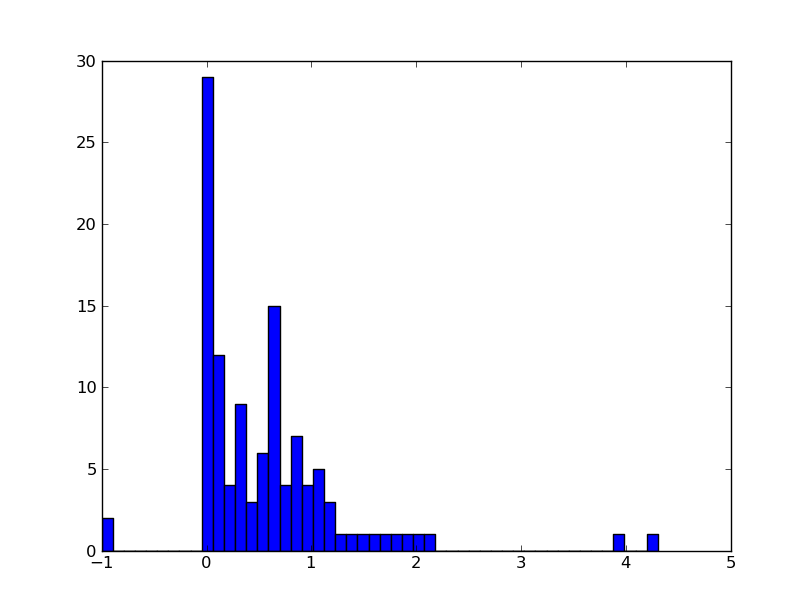
Now examine what you got in the table variables and use
ascii.read() to parse the right one into a table. Then plot a
histogram of the redshift distribution in this sample.
HINT: the table has missing values so include fill_values=('', '-1') in
the call to ascii.read(). astropy.io.ascii has robust functionality to replace bad or
missing values.
Click to Show/Hide Solution
The data are in the second table, so do:
dat = ascii.read(table2, fill_values=('', '-1'))
print(dat)
dat.colnames
dat.dtype
plt.hist(dat['z'], bins=50)
Numpy
Numpy provides two functions to read in ASCII data which we describe here for completeness. In most cases the astropy.io.ascii functionality is recommended since it is more flexible and generally faster.
np.loadtxt is meant for relatively simple tables without missing values:
# Pretend your variable is really a file because loadtxt expect
# a filename as input
from astropy.extern.six.moves import cStringIO as StringIO

c = StringIO("0 1\n2 3")
np.loadtxt(c)
Here is a more complicated example, that is actually useful:
d = StringIO('''
# Abundances of different elements
# for TW Hya
# taken from Guenther et al. (2007)
# element, abund, error, first-ionisation-potential [eV]
C  0.2  0.03 11.3
N  0.51 0.05 14.6
O  0.25 0.01 13.6
Ne 2.46 0.08 21.6
Fe 0.19 0.01  7.9
''')
data = np.loadtxt(d, dtype={'names': ('elem', 'abund', 'error', \
    'FIP'),'formats': ('S2', 'f4', 'f4', 'f4')})

plt.errorbar(data['FIP'], data['abund'], yerr = data['error'], fmt = 'o')
The resulting plot clearly shows the inverse first ionization potential effect. That means, that elements of a large FIP are enhanced in the corona.
The second command np.genfromtxt is more versatile. It can fill missing
values in a table, read column names, exclude some columns etc. Here is an
example (which only works in Python 2 as of Numpy 1.9):
d = StringIO('''
#element abund error FIP
C  0.2  0.03 11.3
N  0.51 0.05 14.6
O  0.25 0.01 13.6
Ne 2.46 0.08 21.6
S  nn   nn   10.4
Fe 0.19 0.01  7.9
other elements were not meesured
''')
data = np.genfromtxt(d, dtype=('S2', 'f4', 'f4', 'f4'), names = True, \
     skip_footer = 1, missing_values = ('nn'), filling_values=(np.nan))
Examine what was returned:
data
This is an instance of the NumPy structured array type, which is an efficient way to manipulate records of tabular data. It stores columns of typed data and you can access either a column of data or a row of data at once:
data.dtype
data[1]
data['abund']